It's Coming...
Did you know May is the least active month of the year? That only seems fitting as it leads right into hurricane season which runs from June through November, with September being the most active month.
What’s in store for 2022? Well, it doesn’t look promising.
While there are no active tropical storms at the time this blog is being written, that doesn’t seem to be the prediction for the rest of the season.

According to NPR, scientists are predicting at least 19 named storms and nine hurricanes this season. Of the nine hurricanes, four are expected to be category 3 or higher.

Sounds like an intense season is upon us. Those numbers are all above average.
What does that mean for us?
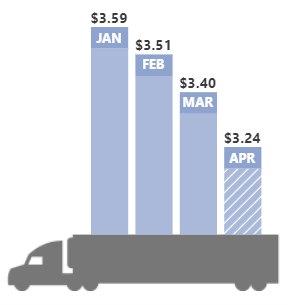
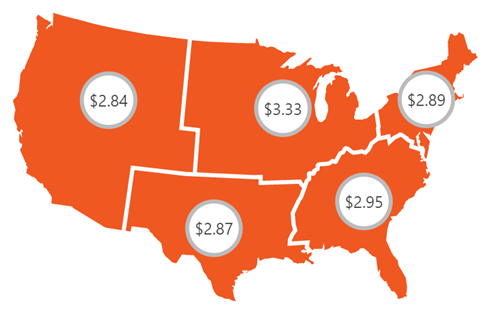
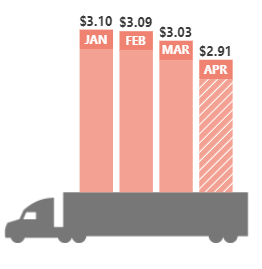
The logistics industry will feel the impacts. Shippers and receivers in coastal areas will have the obvious impacts, but that doesn’t mean others won’t. Drivers will avoid going to certain areas, which will limit capacity. After a storm makes landfall, freight will increase to the impacted areas for recovery efforts, which will drive up rates to those areas. Often, in any natural disaster, fuel availability becomes a very hot topic.
The easy answer is to hope and pray their predictions are wrong. The more realistic answer is to prepare and stay current on the storms throughout the season.
One thing we can guarantee? Our team at PGT will stay on top of all storms and situations. We will provide you with any updates and help guide you through any challenges that arise because of it.