Today we’re reviewing the dry van market and it may appear to be what you expected.
It doesn’t always make sense. We often use numbers to explain why things are the way they are, but sometimes you have to dig a little deeper to understand why the numbers just seem…off.
That’s what happened when we checked out the DAT trendline data for dry vans. At first glance, it looks great- rates are declining quickly. However, if you take a deeper dive into it, it’s not exactly what it seems. Let’s work through it in pieces.
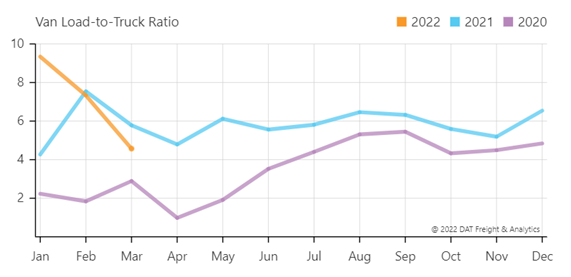
The number of van loads posted on the DAT load board compared to trucks available increased the last week of March, but compared to February, it decreased almost 38%.
The rates are still higher than they were a year ago by 14%, but the trend week over week and month over month is on the decline- at a rate of about 1-2% depending on the time frame.
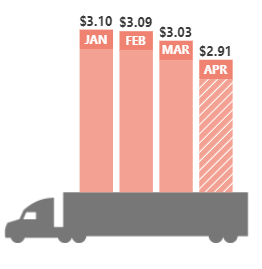
For the first time since December 2021, van spot rates have dropped below $3 per mile on average. While that trend is definitely favorable for the freight industry, there’s also more to consider than just the spot rate: fuel & location being major contributors.
The graphics from DAT below don’t include fuel. The spot rate may be dropping, but the total rate with fuel included isn’t making that kind of significant drop.
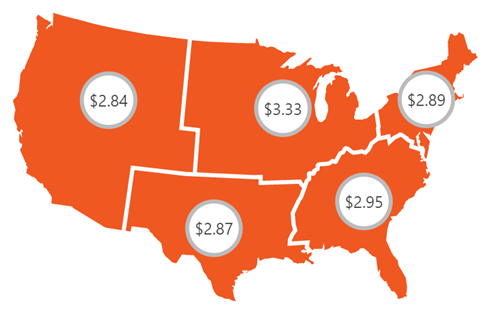
Fuel is, however, starting to drop slowly, so the industry may start to feel the impact in the near future- just not yet. It also depends what part of the country you are in. If you’re in a hot market, rates are remaining steady or even dropping a little. If you aren’t, you’re likely still feeling increases.
The good news is, for the first time in a long time, trends are starting to turn in our favor. Whether or not that will continue and be sustainable is yet to be determined.